We tested 16 chart patterns on 34 million days of price data
Golden cross, death cross, oversold RSI, 52-week highs, volume breakouts, three red days, one-day spikes. Every occurrence across 7,993 US stocks and up to 64 years of history — 12 million events — with the outcome measured against the S&P 500 over the same days, and everything split into before-2018 and since. Five patterns repeat. Three flipped sign. The rest are indistinguishable from noise. Here are the numbers.
All sixteen, next 21 trading days vs the average stock
"Vs the average stock" is the honest yardstick: it is the pattern's average market-adjusted return minus the baseline for the era, because the average stock itself trailed the index badly after 2018. Days are clustered — 3,000 stocks crashing on the same day count once — and outliers are capped so one 10× stock cannot own an average.
| Formation | Occurrences | 1994–2017 | 2018–2026 | Verdict |
|---|---|---|---|---|
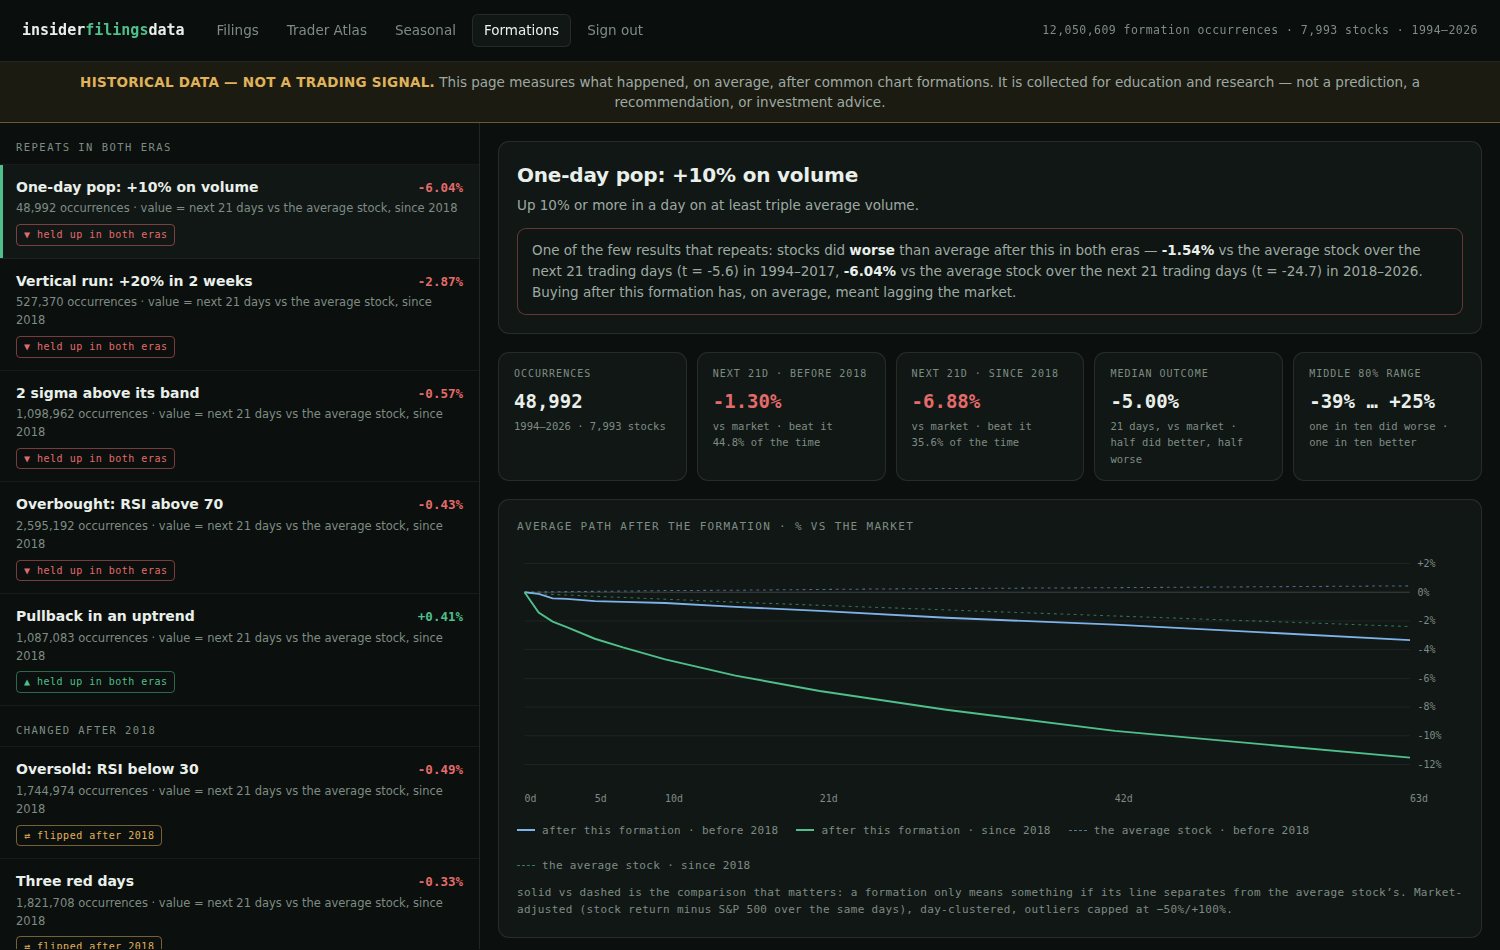
| One-day pop: +10% on 3× volume | 48,992 | −1.54% | −6.04% | repeats, negative |
| Vertical run: +20% in 10 days | 527,370 | −1.38% | −2.87% | repeats, negative |
| 2σ above its 20-day band | 1,098,962 | −0.44% | −0.57% | repeats, negative |
| Overbought: RSI(14) > 70 | 2,595,192 | −0.30% | −0.43% | repeats, negative |
| Pullback in an uptrend | 1,087,083 | +0.20% | +0.41% | repeats, positive |
| Three red days in a row | 1,821,708 | +0.42% | −0.33% | flipped after 2018 |
| Oversold: RSI(14) < 30 | 1,744,974 | +0.33% | −0.49% | flipped after 2018 |
| 2σ below its 20-day band | 891,449 | +0.39% | −0.18% | flipped after 2018 |
| New 52-week high | 877,324 | −0.35% | +0.09% | faded after 2018 |
| Golden cross (50d over 200d) | 47,325 | −0.30% | −0.23% | no reliable signal |
| Death cross (50d under 200d) | 49,334 | −0.10% | +0.28% | no reliable signal |
| Breakout: 20-day high on 2× volume | 228,020 | −0.14% | −1.74% | no reliable signal |
| Crash: −15% in a week | 383,970 | +0.01% | −3.28% | no reliable signal |
| New 52-week low | 433,558 | +0.04% | −2.27% | no reliable signal |
| Quiet squeeze, then breakout | 182,562 | +0.01% | +0.20% | no reliable signal |
| One-day drop: −10% on 3× volume | 32,786 | +0.53% | −1.94% | no reliable signal |
"No reliable signal" means the result failed to hold with statistical significance in both eras — several of these look dramatic since 2018 but had no edge before it, which is exactly how noise looks. Average tilts, not predictions: the spread of individual outcomes is many times larger than every number in this table.
The clearest result argues against chasing
A stock that jumps 10% in a day on triple volume goes on to trail the market — by 1.5% over the next month before 2018, by 6% since. The same family repeats at every strength: +20% two-week runs, closes two standard deviations above the band, RSI over 70. Whatever it feels like to watch a stock go vertical, the base rate after it has been reliably below-market for thirty years. This is the one place where the data speaks with a clear, repeated voice.
The golden cross does nothing
47,325 golden crosses. No measurable information about the next two months, in either era — and its mirror, the death cross, is the same across 49,334 occurrences. This matches what we found when we tested every classic candlestick pattern on 23 years of index data: shapes without a mechanism don't survive counting. Nobody who sells golden-cross alerts publishes this table, which is why we did.
Dip-buying worked — past tense
The three classic oversold signals — RSI under 30, three consecutive down days, a close 2σ below the band — all carried a real positive tilt for two decades, on samples of a million-plus events each. All three have been flat-to-negative since 2018. Effects this well-known tend to shrink once they are well-known; watching one actually flip sign across eras, in your own data, is the best inoculation against backtests that never leave the past.
The one quiet positive
A stock touching a 10-day low while still above its 200-day average — the boring pullback-in-an-uptrend — beat the average stock by +0.2% (pre-2018) and +0.4% (since) over the following month, across a million occurrences in each era. Small, unglamorous, and the only bullish formation of the sixteen that repeated.
Every stock, charted with the arrows — updated daily
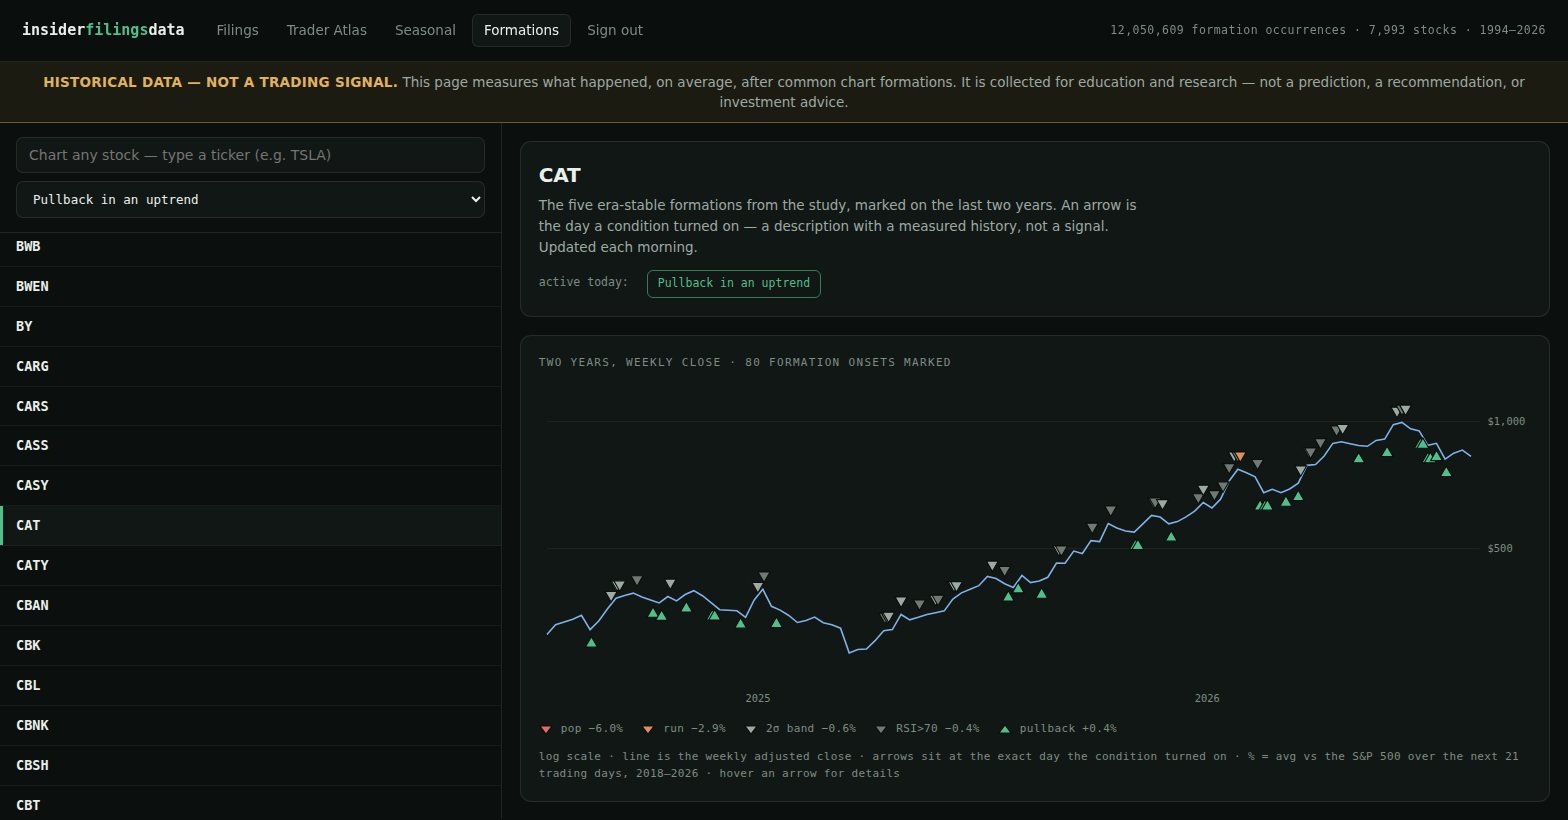
The study is the evidence; this is the daily view of it. Members type any ticker — about 4,100 covered US stocks — and get its last two years with an arrow on the exact day each of the five era-stable formations turned on, each arrow carrying its measured history in the tooltip. Or work the other way: pick a formation and get the full list of stocks where it is active on the latest close — every stock in a pullback-in-uptrend today, everything that just went vertical, every RSI-over-70 name — sorted A to Z down the left, arrow-key through them and the chart follows. Prices refresh every morning, so the lists and arrows are current through yesterday's close. Caterpillar above: an uptrend dotted with green pullback arrows, on the list because it closed at a 10-day low while above its 200-day average.
The rest of the interactive version
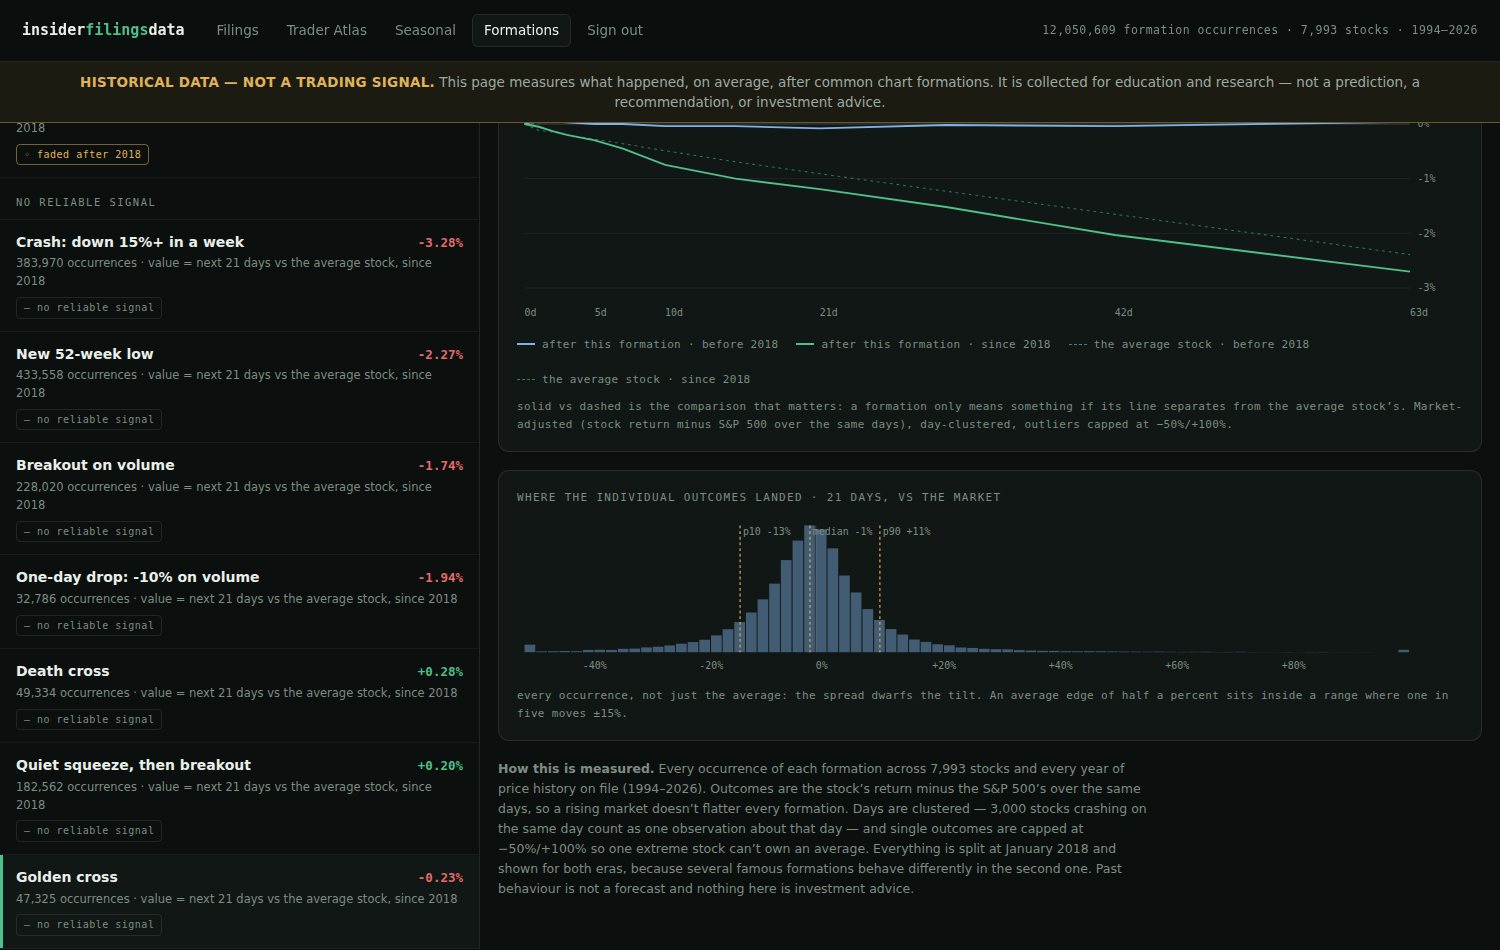
Every formation is also a page of its own: the average path over 63 days drawn against the average stock for both eras, hit rates, the full distribution of individual outcomes, and a plain-language verdict — refreshed weekly. It sits next to the Filings Browser, the Trader Atlas and the Seasonal patterns page, all built on the dataset you can try free.
Method, in one paragraph: daily closes for 7,993 US stocks, split-adjusted, back to 1962 where history exists; a liquidity floor of $1M median daily dollar volume; outcomes are the stock's return minus the S&P 500's over the same days; one average per calendar day per formation (Fama-MacBeth), significance measured across days; outcomes capped at −50%/+100%. Historical description, not investment advice — past behaviour of an average is no promise about any stock, or any future.